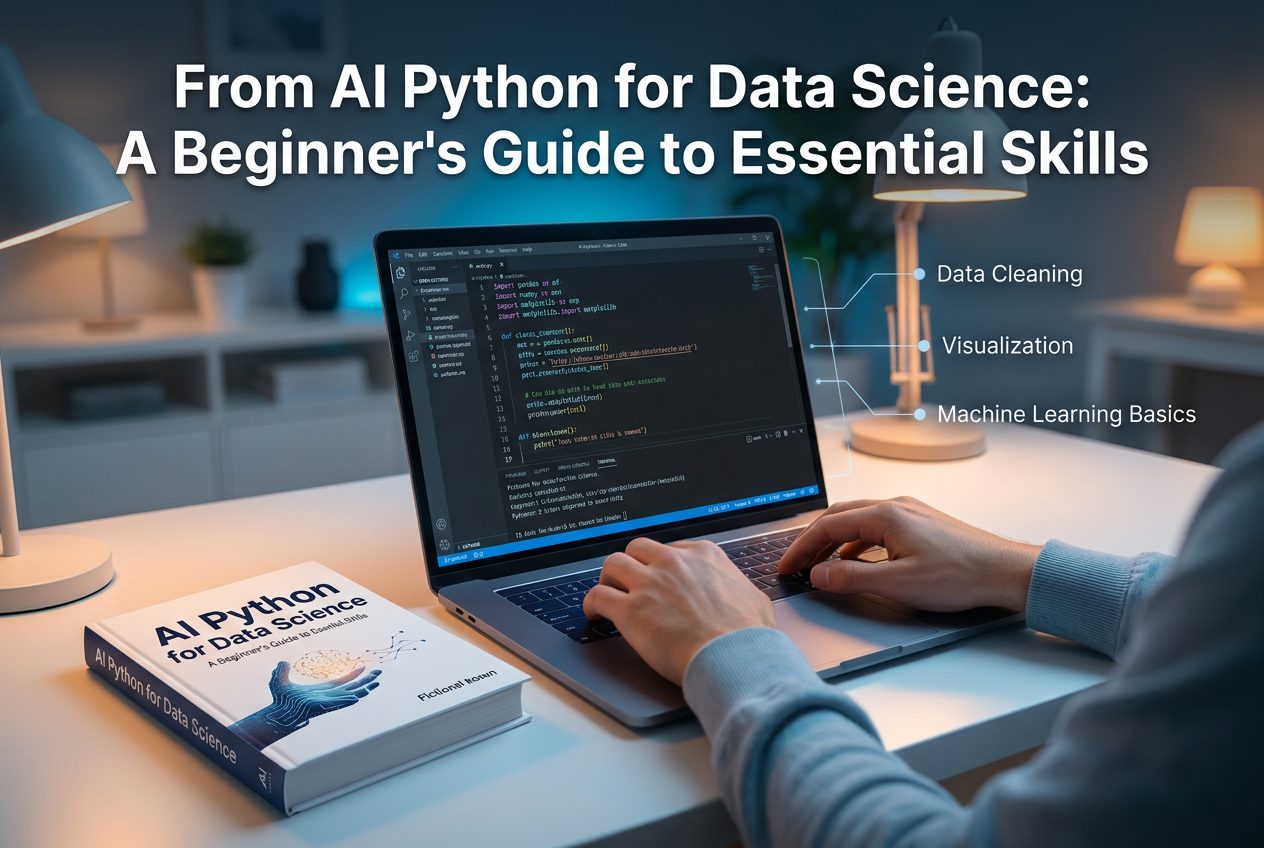
Python has become an important programming language for people working with data because it supports data manipulation, statistical analysis, visualisation and machine learning. Its readable syntax and extensive collection of libraries make it a practical starting point for beginners interested in analytics and artificial intelligence.
For learners exploring AI & Python for data science, the key is to understand how programming concepts connect with real analytical tasks. Learning a few commands is useful, but becoming comfortable with data preparation, problem-solving and interpretation requires regular practice.
Why Python Is Used in Data Science
Data science projects often involve working with large datasets, correcting inconsistencies, exploring patterns and communicating findings. Python provides tools that support each stage of this process.
It is also widely used in automation and machine learning, allowing learners to build on their initial programming knowledge as they progress.
Python is not the only language used for analytics. R, SQL and other technologies also have important roles. However, Python offers a versatile pathway for beginners who want to explore several aspects of data science using one programming ecosystem.
1. Learn the Fundamentals of Python
Before working with data libraries, beginners should understand the core language.
Important concepts include:
- Variables and basic data types.
- Lists, dictionaries, tuples and sets.
- Conditional statements and loops.
- Functions and reusable code.
- Reading and writing files.
- Error handling and debugging.
These concepts help learners write programs that process information systematically. For example, a beginner might write a function to calculate monthly sales totals or identify records that do not meet a particular condition.
Understanding the logic behind the code is more valuable than memorising commands. Learners should practise modifying examples and explaining why their solutions work.
2. Understand SQL and Data Sources
Data scientists frequently work with information stored in databases. SQL helps retrieve and organise records before further analysis.
Beginners should learn how to select columns, filter rows, sort results, group records and join related tables. They should also understand basic database concepts such as tables, keys and relationships.
Imagine a company storing customer details in one table and transactions in another. A SQL join can connect the two datasets so the analyst can examine purchasing patterns by customer group.
Python and SQL often complement each other: SQL can retrieve relevant records, while Python can support deeper analysis and visualisation.
3. Work with NumPy and Pandas
NumPy supports numerical computing, including efficient operations on arrays. Pandas provides data structures and functions that help users organise, clean and analyse tabular information.
With Pandas, learners can inspect datasets, select columns, filter records, group information and calculate summary statistics.
A typical exercise might involve a sales dataset containing product names, dates, quantities and prices. The learner could check for missing values, correct inconsistent formats and calculate revenue by month.
Data cleaning deserves particular attention. Real-world data is rarely perfect, and incorrect assumptions about missing values or duplicates can lead to misleading conclusions.
4. Learn Data Visualisation
Charts help analysts explore patterns and communicate findings to other people.
Common visualisations include:
- Line charts for changes over time.
- Bar charts for comparing categories.
- Histograms for examining distributions.
- Scatter plots for exploring relationships between variables.
Python libraries such as Matplotlib and Seaborn support many of these tasks. Learners should focus on selecting a chart that matches the question, labelling axes clearly and avoiding visual elements that make the result difficult to interpret.
Visualisation is not merely a presentation skill. Creating a chart can reveal unusual values, unexpected patterns or questions that require additional analysis.
5. Build a Foundation in Statistics
Statistics helps learners determine what the data can—and cannot—tell them.
Useful beginner concepts include mean, median, mode, range, variance, standard deviation, probability and correlation. Learners should also understand sampling and the difference between an observed relationship and a causal relationship.
For example, sales may increase during the same period that a business increases its advertising budget. That pattern does not automatically prove advertising caused the increase; other factors may also have influenced demand.
A solid statistical foundation helps analysts explain uncertainty and avoid overconfident conclusions.
6. Progress to Machine Learning and AI
Once learners are comfortable with programming, data preparation and basic statistics, they can begin exploring machine learning.
Initial topics may include regression, classification, clustering, training and test datasets, and evaluation metrics. Learners should understand why a model is selected and how its performance is assessed.
Artificial intelligence extends beyond traditional predictive modelling. Generative AI systems can produce text, code, images and other content. Understanding their capabilities, limitations and responsible use is increasingly relevant, but learners should first develop the ability to evaluate outputs critically.
Not every data problem requires machine learning. Sometimes a clear SQL query, a spreadsheet or a well-designed dashboard is the more appropriate solution.
7. Practise Through Projects
Projects help transform theoretical knowledge into practical experience. Beginners can start with manageable datasets and gradually tackle more complex questions.
Examples include analysing retail sales, exploring public transport data, studying customer churn or creating a dashboard that tracks business performance.
A strong project should document the problem, data source, cleaning process, analytical method, findings and limitations. Learners should be able to explain what they discovered and what further information would improve the analysis.
A portfolio of well-explained projects can support interview discussions and demonstrate problem-solving ability. It does not replace experience or guarantee a job, but it provides evidence of applied learning.
8. Choosing a Learning Program
A structured course can help learners follow a logical sequence and receive feedback on their work. Before enrolling, check whether the program covers Python fundamentals, SQL, data cleaning, visualisation, statistics and practical projects.
Also consider instructor access, class schedules, assessment methods, fees and the terms of any career support. Prospective learners reviewing NUCOT’s data science program should confirm the latest curriculum and conditions directly with the provider and assess whether the program matches their starting level.
Conclusion
Learning Python for data science involves much more than writing code. Beginners need to understand data sources, clean information carefully, apply statistics, create useful visualisations and explain findings clearly.
A practical learning path begins with Python and SQL, progresses through data analysis and visualisation, and then introduces machine learning and relevant AI concepts. Consistent practice and meaningful projects help learners build confidence and develop skills they can apply to real problems